gglyph provides tools for creating network-style visualizations of directed pairwise relationships using custom edge glyphs built on top of ggplot2.
The package includes four functions:
-
geom_glyph(): Create a network-based graph that illustrates pairwise relationships (statistical and non-statistical) using custom edges -
process_data_statistical(): Process statistical data (e.g., pairwise t-tests) for plotting -
process_data_general(): Process general / non-statistical data (any data with directional relationships) for plotting -
generate_mock_data(): Create mock data for experimenting withgeom_glyph()
They should be used in the following order: either 4 → 1 or 2/3 → 1.
Please note that the package has two licenses:
Installation
You can either install the package from CRAN:
install.packages("gglyph")Or you can install the development version from GitHub:
install.packages("devtools")
devtools::install_github("valentinsvelev/gglyph")
Use
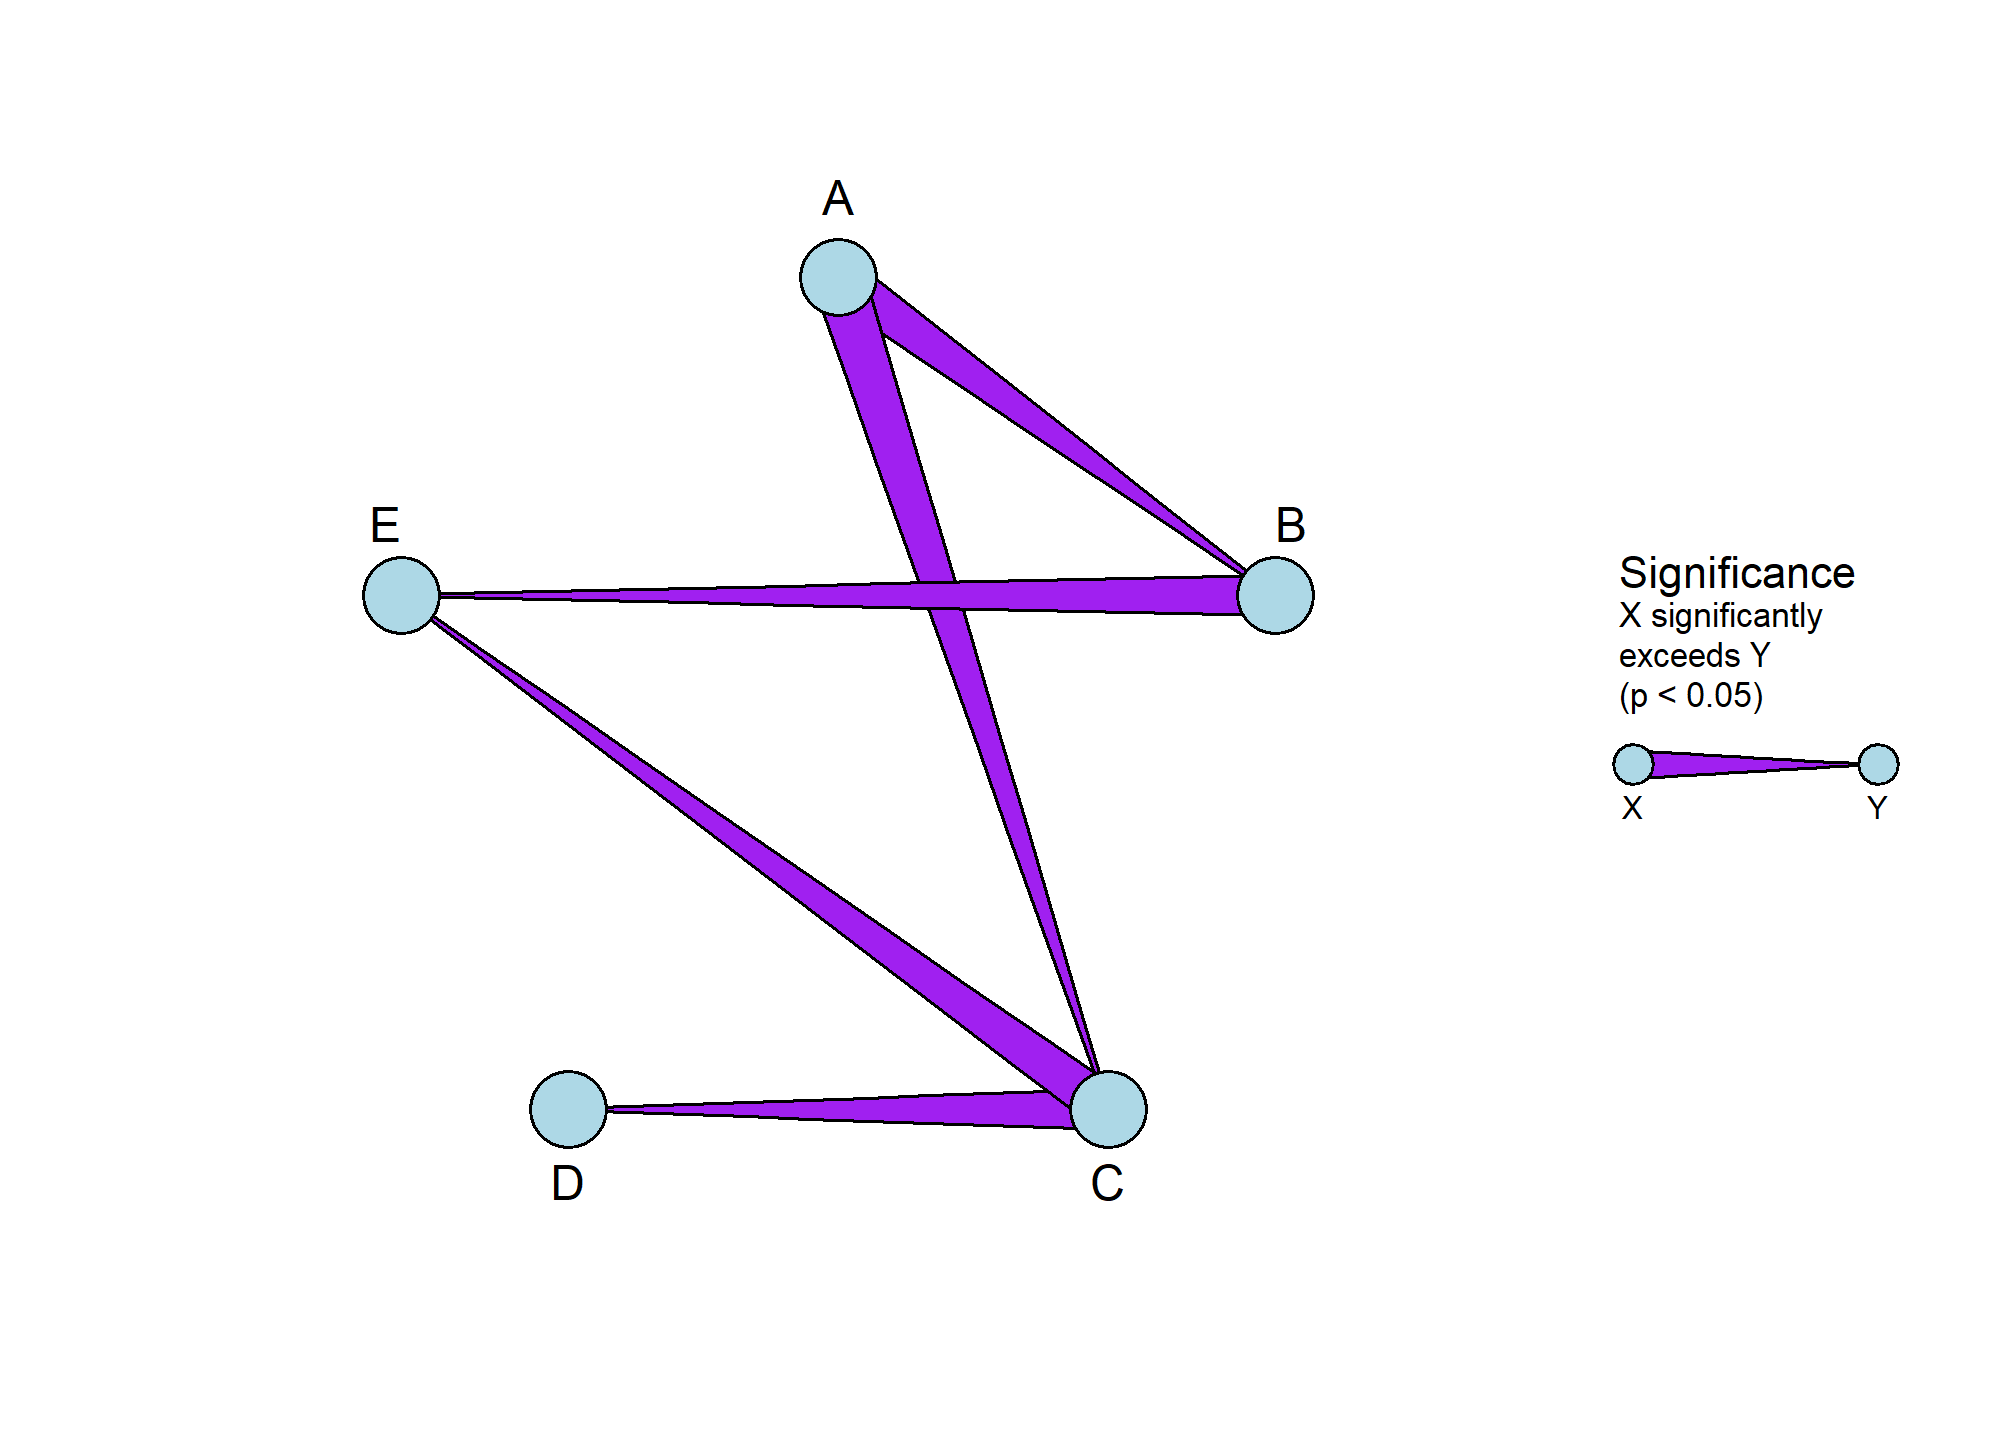
You can use the package as follows:
library(gglyph)
library(ggplot2)

data <- generate_mock_data(n_nodes = 5, n_edges = 15, statistical = TRUE)

ggplot(data = data) +
  geom_glyph(
    edge_fill = "purple",
    edge_colour = "black",
    node_fill = "lightblue",
    node_colour = "black"
  )
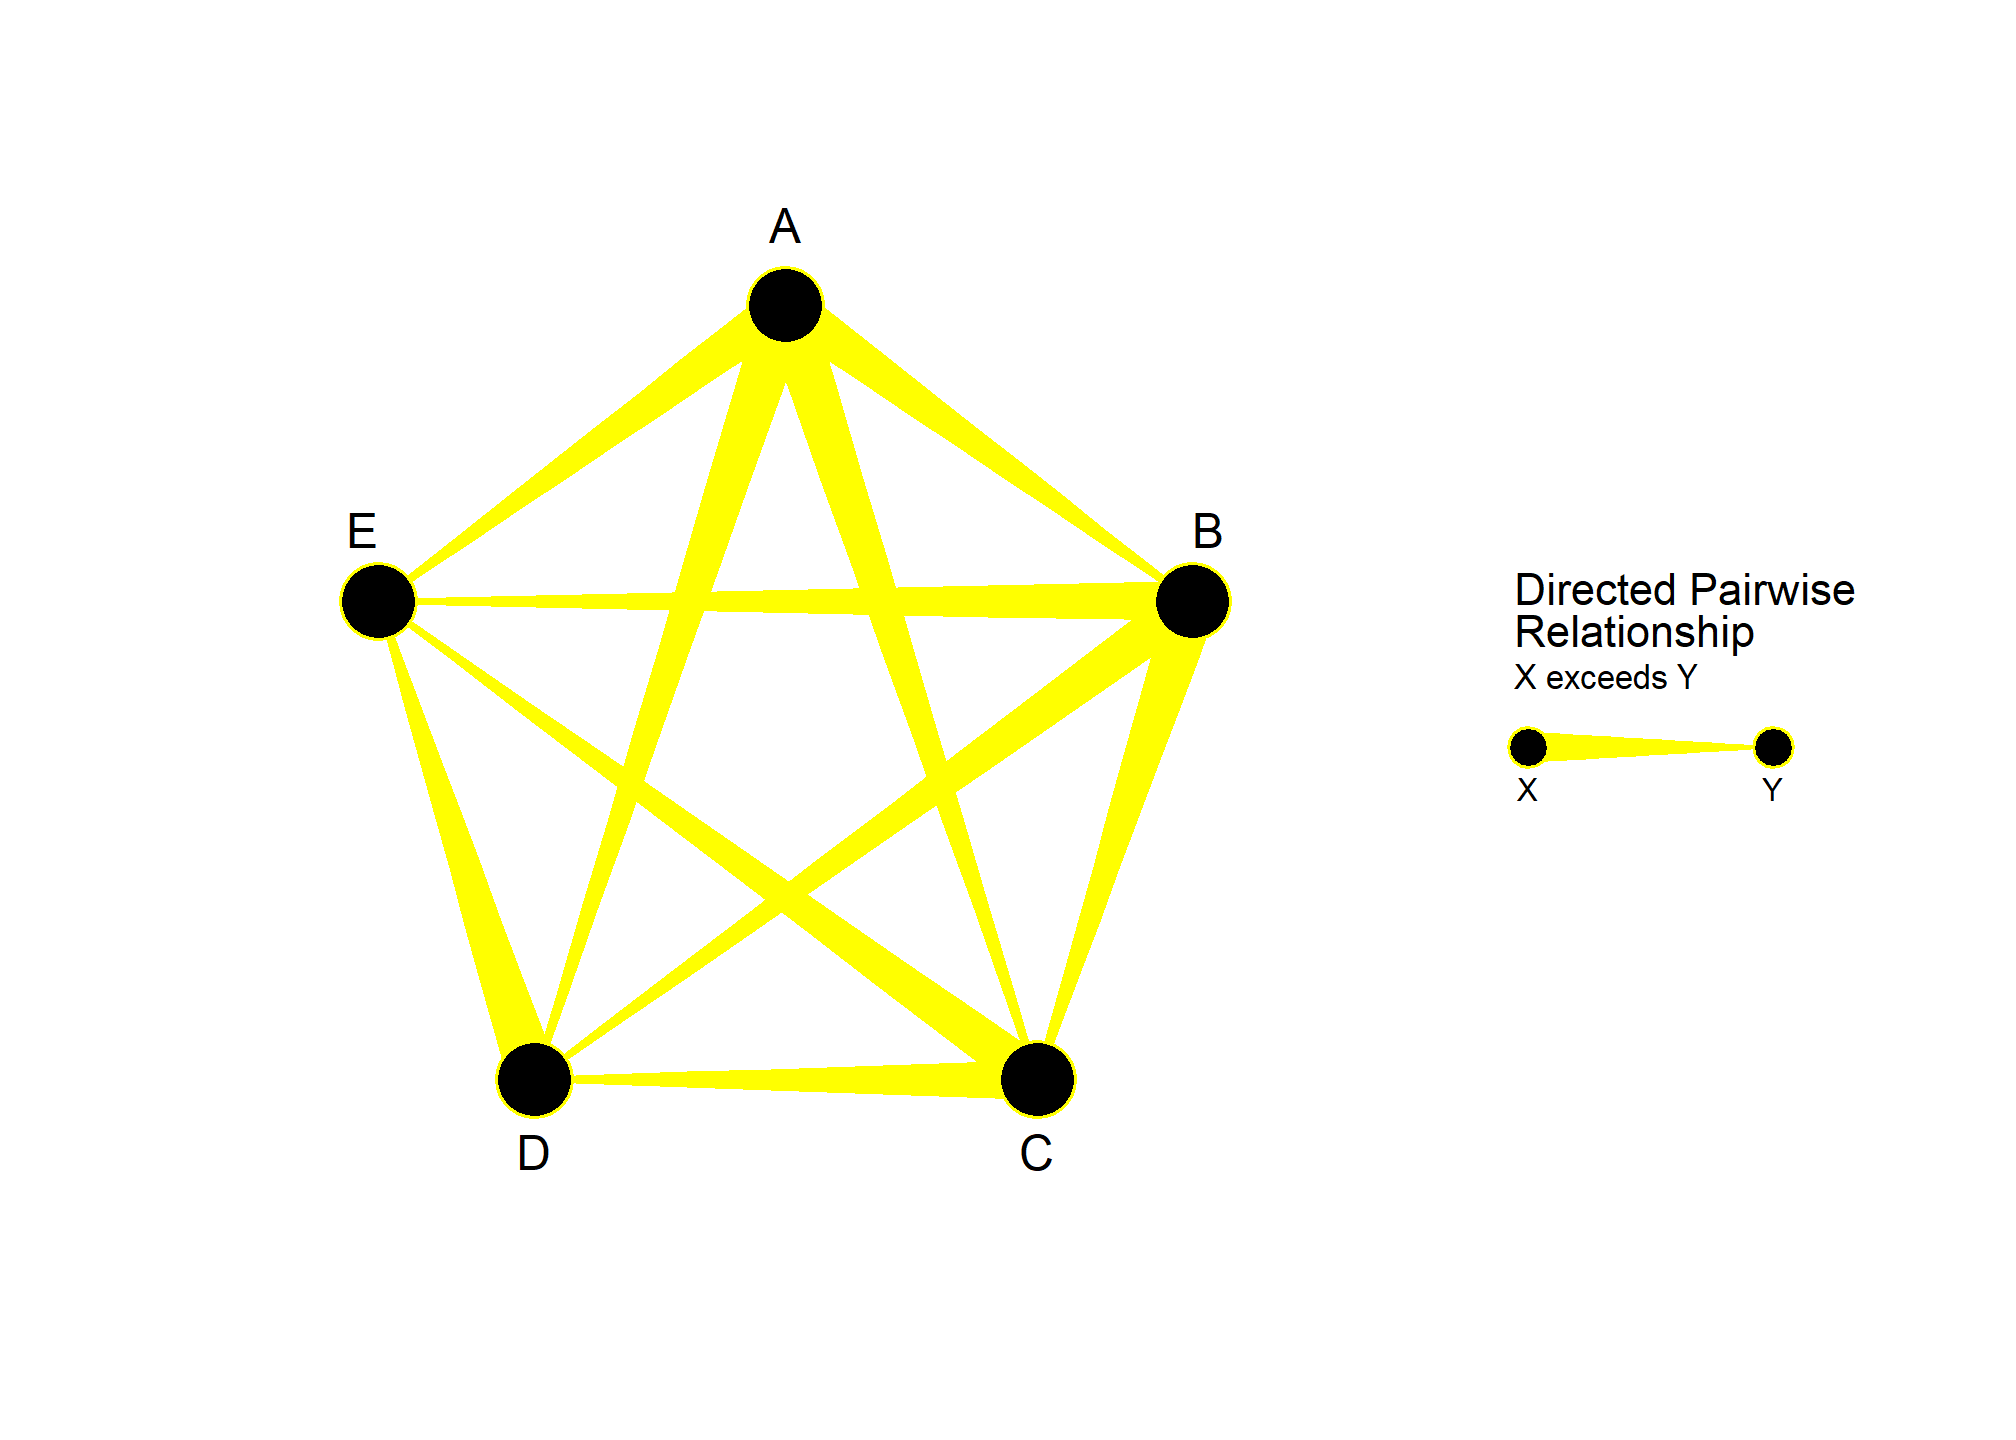
Or with non-statistical data:
library(gglyph)
library(ggplot2)

data <- generate_mock_data(n_nodes = 5, n_edges = 10)

ggplot(data = data) +
  geom_glyph(
    edge_fill = "yellow",
    node_fill = "black",
    node_colour = "yellow"
  )
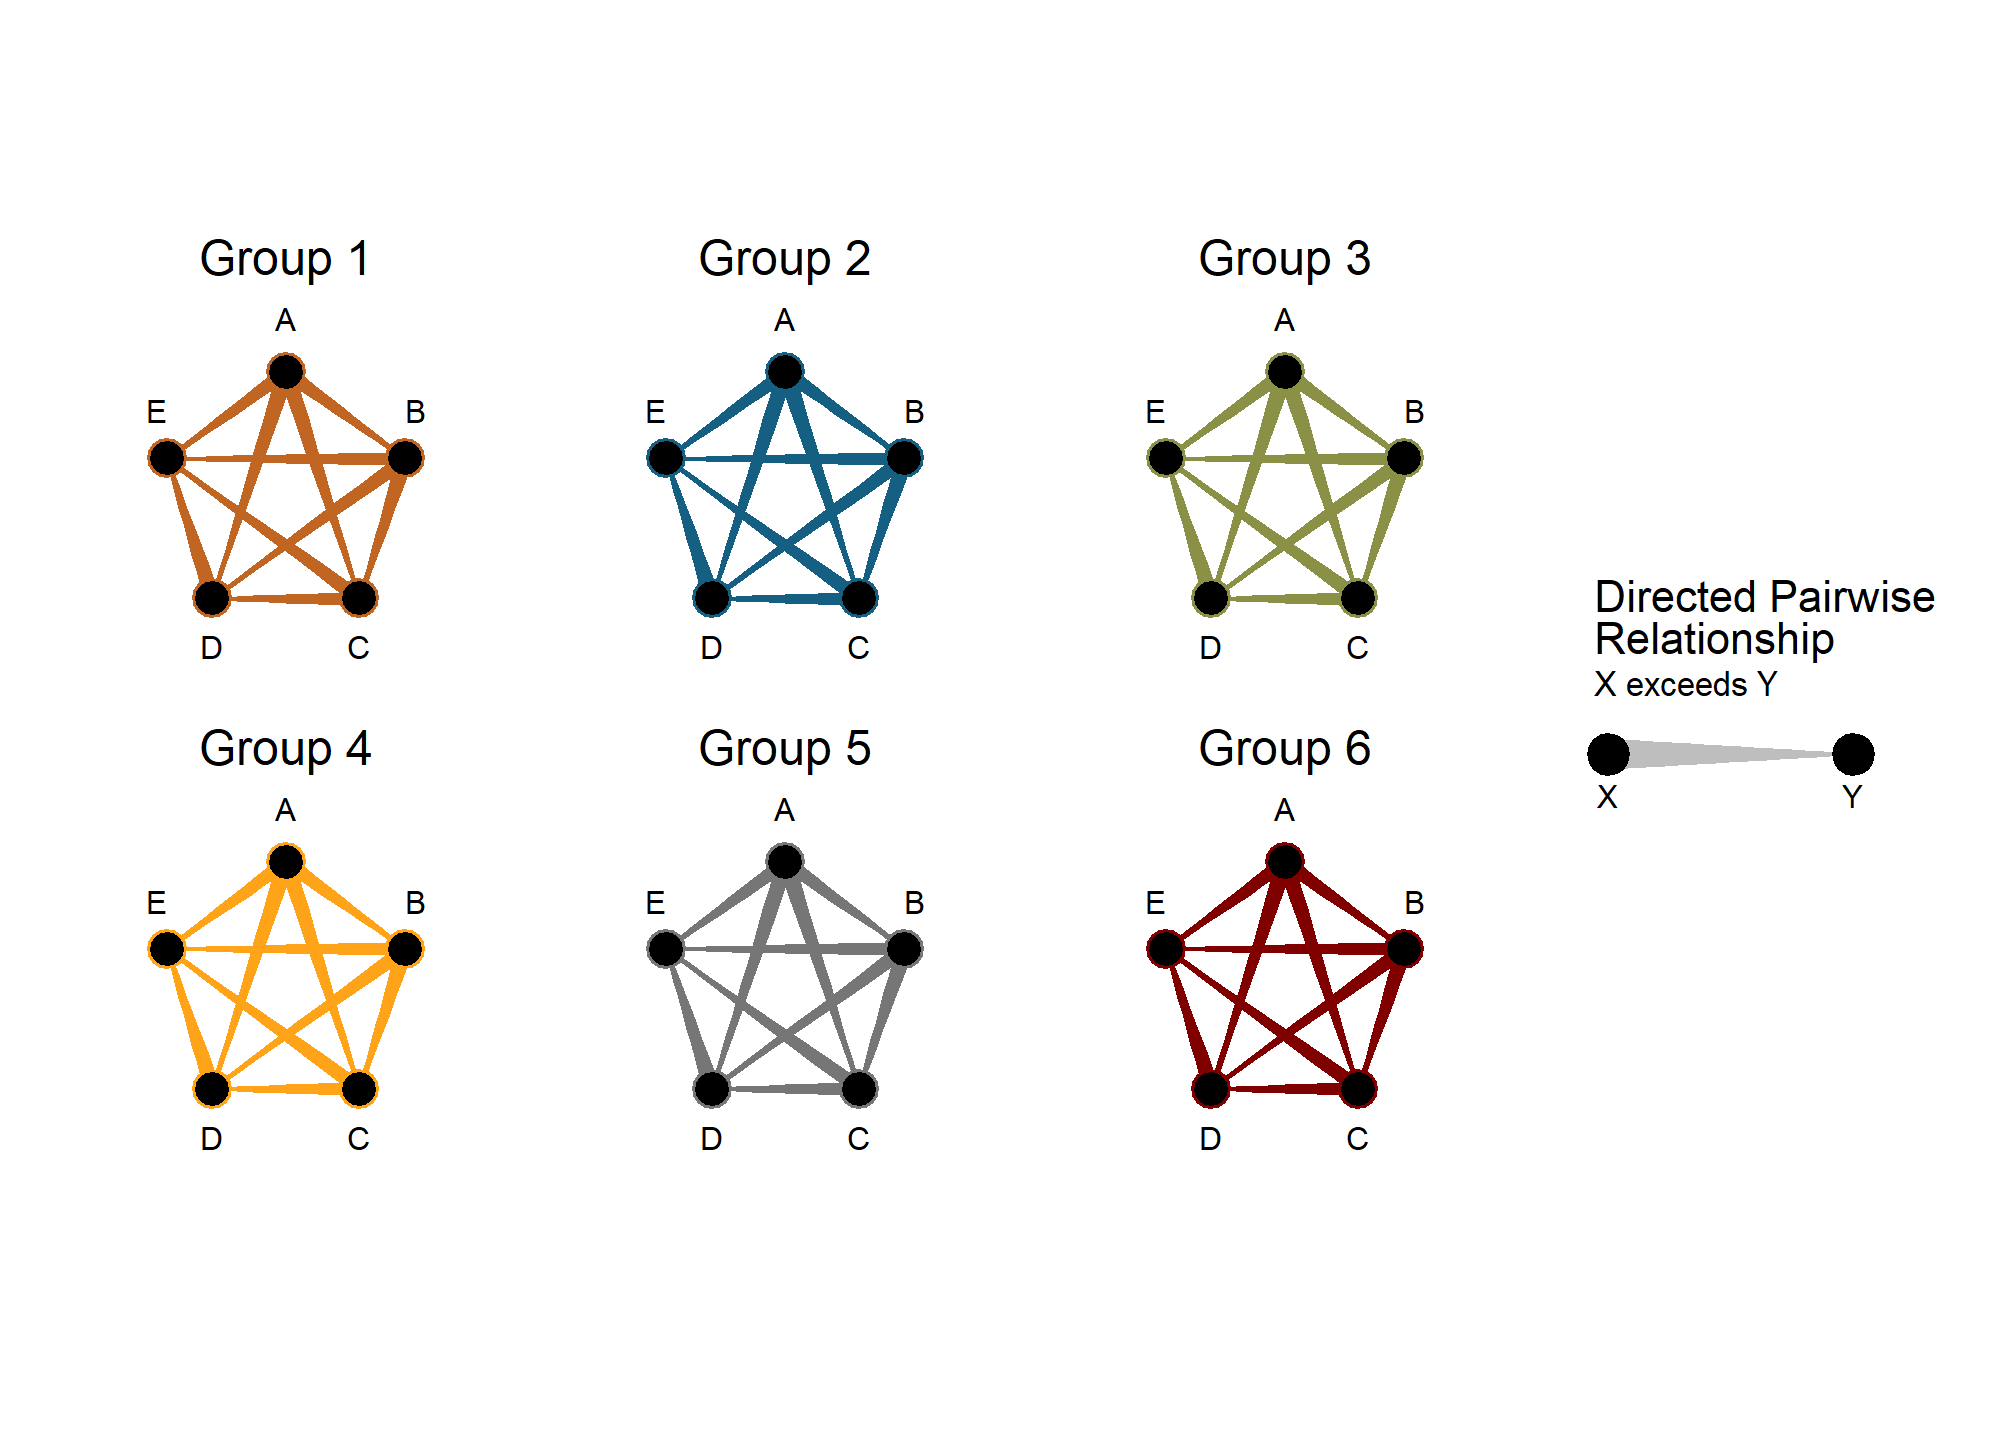
You can also use ggplot2’s facet_wrap() for grouped data:
library(gglyph)
library(ggplot2)
library(ggsci)

data <- generate_mock_data(n_nodes = 5, n_edges = 20, n_groups = 6)

ggplot(data = data) +
  geom_glyph(
    edge_fill = pal_uchicago(),
    node_fill = "black",
    node_colour = pal_uchicago()
  ) +
  facet_wrap(~ group)